Tuesday, December 16, 2014

Nucleate Boiling and More, Subcooled

For the record, more sometime.  Left click to see the show.


Sunday, December 14, 2014

Bunk from academia regarding nucleate boiling on small wires

Here is an "informative" link from the 1970's.

I've copied the following and added some highlights (bold).

BOILING FROM SMALL CYLINDERS* 

NANIK BAKHRU IBM Corporation, Hopewell Junction, New York 12533, U.S.A .
and
.JOHN H. LIENHARD  Dept. of Mechanical Engineering, University of Kentucky, Lexington, Kentucky 40506, U.S.A.
(Received 27 Seprember 1971)

Abstract-Heat transfer is observed as a function of temperature on small horizontal wires in water and four organic liquids. When the wire radius is sufficiently small, the hydrodynamic transitions in the boiling curve disappear and the curve becomes monotonic. Three modes of heat removal are identified for the monotonic curve and described analytically: a natural convection mode, a mixed film boiling and natural convection mode, and a pure film boiling mode. Nucleate boiling does not occur on the small wires.

In the text you will find:

Since the wires would melt during atmospheric runs in water,  the water runs were all made at pressures in the neighborhood of 3 in. Hg abs.

It is absurd to operate at reduced pressure in order to avoid burnout.  Think about it.

Nucleate boiling was averted by operating at reduced pressure.  Burnout was avoided by limiting the maximum power.  Burnout could likewise have been avoided at atmospheric pressure.
  
Nucleate boiling will occur on the "small cylinders" at higher pressures. Below are four runs with 0.0003 inch platinum "cylinders" and nucleate boiling (phase change heat transfer) is evident.  Right click on "view image" to view the entire plots.  No, I give up.  Left click on the lower image to enlarge and to return here click on the reload (circular) arrow.


Friday, November 28, 2014

My 30 year anniversary UHI and the NRC Training Center (Simulator)


I knew how to operate; of course, I knew my stuff!


The caption below refers to a photograph from today's (May 5, 2010) NRC web page.

NRC Commissioner William Ostendorff (center) recently toured the agency’s Technical Training Center, established in 1980, in Chattanooga, Tenn. where nuclear plant simulators, like the one shown here, provide hands-on training for NRC engineers.
Of course, I wonder about the quality of that hands-on training for NRC engineers. Baker-Just and Cathcart-Pawel are alive and likely the 2200 Fahrenheit game is in the NRC's simulator.
The NRC engineers' time would be better spent in a study of PRM-50-93 and its associated public comments.

The above caption says the Technical Training Center was established during 1980. Following is my experience with that Center during 1984. Click to enlarge; your return arrow gets you back.


Here is more!


THURSDAY, AUGUST 16, 2012


UHI Ultra High Risk EPRI NSAC NRC Ohi

This is the third consecutive entry in my UHI series.   Here are three uploaded pages that document part of the turmoil that followed my October 3, 1984, memorandum, UHI-Ultra High Risk.    Click on the page to enlarge for easier reading and access to the right side that is partially obscured.


As I said in earlier, my October 3, 1984 memo let to a lot of turmoil.  The heat was on. I was fighting for survival, so I worked on the day after Thanksgiving and it was an advantage to have no others around.

The above memorandum was addressed to Lang who had been assigned to monitor (to control) the UHI investigations.  So, I worked within the system, and addressed all correspondence to Lang, but I worked independently. I stayed under control because I intended to continue working for EPRI, however, my above contact with the NRC Training Center was effective and there was no way that NSAC could reprimand me for pursuing that credible source even though it alarmed Rossin and very likely others.

Rossin was apparently concerned that Taylor would think Leyse was out of control, hence his note of 11/30 (1984) in which he stopped distribution to J. J. Taylor, the head of the EPRI Nuclear Power Division. 

I'll have further documentation of the very revealing UHI  turmoil that raged within NSAC and EPRI. Several outside organizations became involved including at least three within the NRC. The SANDIA National Laboratory was drawn into the turmoil as a consultant to the NRC.  The ACRS wrote a letter to the Commissioners of the NRC and I'll also post that later.  EPRI even hired an outplacement service, Ward Associates on the famous Sand Hill Road, and later you read how that action intensified the turmoil, although I believe it worked to my advantage.

And More.  It is a great 30th Anniversary!

TUESDAY, AUGUST 21, 2012


UHI Ultra High Risk, October 3, 1984: Inside Stuff, EPRI & NRC

This is my sixth consecutive entry that documents the turmoil that followed my memorandum, UHI Ultra High Risk, October 3, 1984.

This entry jumps ahead of a lot of documentation that I have and that I guess I'll have to place in book if I ever get around to writing that.  On November 7, 1984, Rossin and Breen told me my position was being eliminated, but that I'd have a few months to look for work elsewhere.  So, I looked elsewhere with no immediate success.  I talked to Jim Keppler of the NRC and showed him my memorandum, UHI Ultra High Risk, October 3, 1984, as part of several illustrations of my experience and capabilities.  Keppler asked if he could send this elsewhere in NRC and I agreed, however, I blanked out the source of the document as well as my name.

So, the following two pages are an interesting document that reveals very secret relationships between EPRI and the NRC that I was never aware of.  It also reveals turmoil.  I do not recall how I gained access to the following document; it most certainly was not sent to me.  I am inclined to doubt that Rossin was aware of it, but I do not know that.  I suspect that Layman and Lang were not aware that my position had been eliminated.  On the other hand, 
Rossin may have encouraged this documentation in order to justify getting rid of Leyse. Click to enlarge and back arrow to return.


I'm certainly pleased that EPRI (Layman and Lang) documented the above. This is a clear report of a basically secret set of arrangements between EPRI and the NRC and I suspect that those have continued in various forms over the years and are really intense in today's post-Fukushima world. 

The second page is "interesting" as it describes the "running around" in generating a response to Keppler.  The very last paragraph is also revealing as EPRI apologizes to the NRC for my contact with Keppler.  Well, it is a fact that I was never a party to contacts with the NRC regarding our analyses of operating experience at nuclear power plants.  It is also a fact that others who analyzed operating experience were not very adept at that work.

More later.


Sunday, November 23, 2014

5th International Conference on Boiling Heat Transfer Montego Bay, Jamaica, May 4-8, 2003

 5th International Conference on Boiling Heat Transfer
Montego Bay, Jamaica, May 4-8, 2003

Monday, October 13, 2014

Auracher Nukiyama Boiling Analysis

Here is reference that may be useful.
http://www.jsme.or.jp/ted/NewsLetter42/Auracher_J.pdf

http://www.jsme.or.jp/ted/NewsLetter42/Auracher_J.pdf

Some Remarks on the Nukiyama Curve
Hein Auracher
Professor, Dr.−Ing.
Institut für Energietechnik
Techniche Universität Berlin
auracher@iet.tu-berlin.de

It was about 70 years ago when Shiro Nukiyama published his pioneering paper on “Maximum and Minimum Values of Heat Q Transmitted from Metal to Boiling Water under Atmospheric Pressure” [1]. A milestone at the beginning of a long way towards the “truth” in boiling heat transfer. Numerous researchers
discovered a lot on this way but the more we find out the more difficult it becomes to really understand this extremely complex process.

Basically Nukiyama’s boiling curve has never been disputed. Only specific aspects were and are subject of studies or disagreements. The shape of the boiling curve, for instance, is still a subject of discussions in terms of its behavior in the transition region, its change in a transient situation with respect to the steady-state case, its dependence on contaminations on the heating surface etc. 

The shape of the boiling curve and its change under
different system conditions is, of course, a result of different boiling mechanisms and their change. Since pure empirism can never solve such problems, several physical models for the different boiling modes have been developed. We should trust these models only after experimental verification. Moreover, due to the improvement of our experimental techniques and also of the mathematical tools in recent years, older and relative simple models can now be improved and new ones can be developed.

The present report makes some remarks on the aspects mentioned above. Of course not comprehensive and – subject of excuse – focused mainly on our own work. It is just meant as a small tribute to Nukiyama’s pioneering work. Those who need a sort of survey on new developments may look into the “Proceedings of the 5th Int. Boiling Heat Transfer Conf. in Jamaica, May 2003”. A selection of the papers presented there will soon be published in the “International Journal of Heat and Fluid Flow”.

HYSTERESES ALONG THE NUKIYAMA CURVE
No contradiction exists about a hysteresis in the region of nucleation incipience (see Fig. 1). In contrast, in transition boiling and for steady-state conditions a hysteresis was postulated [2] consisting of a transitional nucleate boiling–and a film boiling–branch, both overlapping with respect to the heat flux. However, if a precise temperature control system [3] is available and with a clean heating surface, boiling curves even for liquids with large contact angles (water) show no hysteresis regardless in which direction they are measured: stepwise from
film to nucleate boiling or vice versa. In contrast, if surface contamination is involved, boiling curves are not reproducible. Each test run, even under carefully established steady- state conditions, results in a shift of the curve already at a minimal change of the deposit [3,4].
log
CHF
MHF
surface
evaporation
nucleate
boiling
transition
boiling
film
boiling
incipience of
nucleation
∆T = TW - Tsat
q
heat
flux
wall superheat
B
A
A
B
Fig. 1: The Nukiyama curve.

The boiling curve behavior log
changes under transient conditions,
even on clean surfaces. Recently it
was argued that “how the unsteady
process influences the hysteresis is not
cleared, yet” [5]. Objection! It is, as
shown by systematic experiments in
[6]. There, measurements with
controlled heating and cooling rates
were carried out, of course, by taking
into account the “coupling problem
[5]” between heater and fluid which
requires the solution of an inverse heat
conduction problem. One typical
result is shown in Fig. 2: The

steady-state curve was measured with 

JSME TED Newsletter, No.41, 2003


Saturday, October 11, 2014

Upton Sinclair Wisdom

"It is difficult to get a man to understand something, when his salary depends upon his not understanding it."

Sunday, October 5, 2014

Power Transformer Lifetime

Here is a reliable reference:

http://site.ge-energy.com/prod_serv/plants_td/en/downloads/powergrid_europe07.pdf 


POWER TRANSFORMER LIFE EXTENSION 
THROUGH BETTER MONITORING

Brian D. Sparling, Jacques Aubin
GE Energy
Power Transformer Reliability

Power transformers are essential components of transmission systems and often the most valuable asset  in a substation. Winding construction is based on the time-proven technology of copper conductor, wrapped in cellulose insulation, and fully impregnated with insulating oil. With a Mean Time Between Failure (MTBF) above 100 years, transformers are regarded as highly dependable equipment. However, the general transformer population is now aging. This by itself would increase the risk of failure but it is  compounded by the trend to load transformers to higher levels to meet economic constraints of deregulated power systems environment. 

Saturday, October 4, 2014

The Boiling Heat Transfer Laboratory at UCLA has been shut down.

Really, the Boiling Heat Transfer Laboratory at UCLA has very likely not been shut down.  However, its web page is unavailable, and that is unfortunate. 

I have made email requests for an explanation, here is the latest, but I have had no response.
Boiling Heat Transfer Laboratory
Date: 10/1/2014 12:44:11 P.M. Mountain Daylight Time
From: Send IM to: BobleyseBobleyse@aol.com
To: gwarrier@ucla.edu
Sent from the Internet (Details)
Gopi:
It has been a while since I contacted the Boiling Heat Transfer Laboratory; in fact, I was the first to contact that site a while back.  However, I have been trying for the past several weeks with no luck. So, what is going on?
Bob                bobleyse@aol.com

Here is an entry to this blog from a while back.  The first two links yield prompt responses.  However the third link (to my paper) is unresponsive. And the fourth link (to the Boiling Heat Transfer Laboratory at UCLA) is also unresponsive.

Of course, I am not pleased.  


THURSDAY, OCTOBER 9, 2008


Boiling Heat Transfer Gang

I reported my great discoveries in abbreviated form during 2002:

http://www.millpress.nl/shop/abooks/THERMES/THERMES/195.pdfand


http://www.foresight.org/Conferences/MNT9/Abstracts/Leyse/index.html

Next, I intoduced UCLA (Dhir) to this field and I presented a more detailed paper at the Montego Bay Boiling Conference during 2003.


Leyse, R.H., Meduri, P.K., Warrier, G.R. and Dhir, V.K., “MICROSCALE PHASE CHANGE HEAT TRANSFER AT HIGH HEAT FLUX,” Proceedings of the 5th International Boiling Heat Transfer Conference, Montego Bay, Jamaica, May 4-8, 2003.


http://boiling.seas.ucla.edu/Publications/Conf_LMWD2003


Previous Boiling Conferences and their corresponding chairs:
YEAR
Country
Chair

1992
Santa Barbara, CA, USA
V.K. Dhir (UCLA)

1995
Banff, Canada
J. Chen (Lehigh University)

1997
Irsee, Germany
F. Mayinger (University of Munich)

2000
Girdwood, Alaska, USA
A. Bar-Cohen (University of Minnesota)

2003
Montego Bay, Jamaica
J. Klausner (University of Florida)

2006
Spoleto, Italy
G.P. Celata (ENEA)

Sunday, August 31, 2014

Rickover and Rigged Research

Obviously, adverse data could have had serious consequences.

And, an effective way to avoid adverse data is to rig the research.  One set of rigged research is 
the Baker-Just equation which has its roots at Rickover's Bettis.  This is documented on pages 345 and 346 of:

Nuclear Power from Underseas to Outer Space
American Nuclear Society, 1995 - Technology & Engineering - 467 pages

John Simpson, former president of Westinghouse Power Systems Company and past president of the American Nuclear Society, provides a vibrant account of the events associated with the birth of the nuclear industry. Simpson's account of his career and the many turns it took is formidable. 

Following are excerpts from pages 345 and 346:

The question was raised whether ignition of zirconium, even if locally initiated, could spread in an uncontrollable manner to a major fraction of the zirconium contained in a core. The accident condition under which such a reaction was considered most likely to occur was a loss-of-coolant accident in which a coolant pipe would suffer a major break.

If it could be shown that Zircaloy-4 reacted with water in a predictable manner at all temperatures, up through its melting point, this should assuage fears of unpredictable and uncontrollable reactions.  These data were required in less than three weeks.  An experiment was devised by Bill Bostrom in which samples of zirconium tubing similar to those used in Shippingport were heated  inductively while immersed in water; the released volume of  hydrogen was collected and used to monitor the rate  of reaction. Barricades were set up around the water container and a system of mirrors was devised so engineers could control metal temperature during the reaction.  Another engineer 
 observed the change in hydrogen volume as it bubbled  up through the water column.  Temperatures were gradually 
increased in consecutive experiments until, as a grand finale, zirconium was melted under water and the amount of reaction monitored during melting. 

These experiments, completed during the required time  period, demonstrated that the occurrence of high temperature reaction rates could be extrapolated from those measured at lower temperatures, and that no new or unexpected phenomena intervened that would endanger reactor plant safety. Crude as these initial experiments were, the  kinetic data derived from them and the conclusions 
drawn have been supported by subsequent experiments
and analyses.  Obviously, adverse data could have had serious consequences.


http://pbadupws.nrc.gov/docs/ML1009/ML100950085.pdf

Please read page 1 of 8, ignore the rest.


Saturday, August 30, 2014

Enformable reports spent fuel pool accident at Fukushima Daiichi Reactor 3

Posted: 29 Aug 2014 06:11 AM PDT

http://enformable.com/wp-content/uploads/2014/08/Fukushima-Daiichi-Unit-3-Spent-Fuel-Pool-Refueling-Machine-Control-Console.jpg
At the crippled Fukushima Daiichi nuclear power plant, workers accidentally dropped a large piece of debris into the Unit 3 spent fuel pool on Friday, a little after noon.
The workers were carrying out operations to remove debris with a large remote controlled crane.  At the time of the accident, workers were manipulating the control console for the refueling machine, a piece of equipment that weighs almost a thousand pounds.
Tokyo Electric, who is in charge of cleanup operations at Fukushima Daiichi, told reporters that they have not detected any change in radiation levels around the spent fuel pool after the accident.
TEPCO is working to check the 566 spent fuel assemblies in the Unit 3 spent fuel pool to see if any of them have been damaged by the most recent accident.  According to decommissioning plans, the utility is scheduled to start removing spent fuel rods from the Unit 3 spent fuel pool in the first half of 2015 at the earliest.
This is not the first time that debris and large objects have been accidentally dropped, pulled, or pushed into the Unit 3 spent fuel pool.  Between 2012 and 2013, TEPCO workers used the remote control cranes to remove debris from atop the Unit 3 reactor building, and multiple instances were recorded where operators moving cranes via remote control knocked debris into the spent fuel pool or dislodged other materials on the roof.
In February 2013, workers accidentally knocked the 1.5 ton fuel handling machine mast into the Unit 3 spent fuel pool, and it was later found to have come to rest on top of the spent fuel racks after it narrowly avoided damaging the liner of the spent fuel pool.

Saturday, August 23, 2014

Mark Edward Leyse’s Comments on the Proposed Rule: 10 C.F.R. § 50.46(c)

Mark Edward Leyse’s Comments on the Proposed Rule for Performance-Based Emergency Core Cooling Systems Cladding Acceptance Criteria: 10 C.F.R. § 50.46(c)
2
TABLE OF CONTENTS
Mark Edward Leyse’s Comments on the Proposed Rule for Performance-Based Emergency Core Cooling Systems Cladding Acceptance Criteria: 10 C.F.R. § 50.46(c)…………………...………3
I. Statement of Commenter’s Interest…………………..…………………………………………3
II. Considering the Thermal Resistance of Crud and/or Oxide Layers in Loss-of-Coolant Accident Analysis.……………………………………………………………………….………..4
III. Results of the PHEBUS B9R-2 Test Pertain to How Breakaway Oxidation Could Affect a LOCA ….……………………………………………………………………………...…………..6
IV. Results of the PHEBUS B9R-2 Test Pertain to the 2200°F Peak Cladding Temperature Limit….………………………………………………………………………………..…………..9

In these comments, Mark Edward Leyse responds to the U.S. Nuclear Regulatory Commission’s (“NRC”) solicitation of public comments—published in the Federal Register on March 24, 2014—on a proposed rule, revising the acceptance criteria for the emergency core cooling system (“ECCS”) for light-water nuclear power reactors.
I. Statement of Commenter’s Interest
On March 15, 2007, Mark Edward Leyse submitted a 10 C.F.R. § 2.802 petition for rulemaking, PRM-50-84,1 to NRC. PRM-50-84 requested that NRC make new regulations: 1) to require licensees to operate light water reactors under conditions that effectively limit the thickness of crud (corrosion products) and/or oxide layers on fuel cladding, in order to help ensure compliance with 10 C.F.R. § 50.46(b) ECCS acceptance criteria; and 2) to stipulate a maximum allowable percentage of hydrogen content in fuel cladding.
Additionally, PRM-50-84 requested that NRC amend Appendix K to Part 50—ECCS Evaluation Models I(A)(1), “The Initial Stored Energy in the Fuel,” to require that the steady-state temperature distribution and stored energy in the fuel at the onset of a postulated loss-of-coolant accident (“LOCA”) be calculated by factoring in the role that the thermal resistance of crud and/or oxide layers on cladding plays in increasing the stored energy in the fuel. PRM-50-84 also requested that these same requirements apply to any NRC-approved best-estimate ECCS evaluation models used in lieu of Appendix K to Part 50 calculations.
In 2008, NRC decided to consider the issues raised in PRM-50-84 in its rulemaking process.2 And in 2009, NRC published “Performance-Based Emergency Core Cooling System Acceptance Criteria,” which gave advanced notice of a proposed rulemaking, addressing four objectives: the fourth being the issues raised in PRM-50-84.3 In 2012, the NRC Commissioners voted unanimously to approve a proposed rulemaking—revisions to Section 50.46(b), which will
1 Mark Leyse, PRM-50-84, March 15, 2007 (ADAMS Accession No. ML070871368).
2 Federal Register, Vol. 73, No. 228, “Mark Edward Leyse; Consideration of Petition in Rulemaking Process,” November 25, 2008, pp. 71564-71569.
3 Federal Register, Vol. 74, No. 155, “Performance-Based Emergency Core Cooling System Acceptance Criteria,” August 13, 2009, pp. 40765-40776.
4
become Section 50.46(c)—that was partly based on the safety issues Petitioner raised in PRM-50-84.4
Leyse also coauthored a paper, “Considering the Thermal Resistance of Crud in LOCA Analysis,”5 which was presented at the American Nuclear Society’s 2009 Winter Meeting.
II. Considering the Thermal Resistance of Crud and/or Oxide Layers in Loss-of-Coolant Accident Analysis
As published in SECY-12-0034, regarding the thermal effects of crud and oxide layers, the proposed rule for Section 50.46(c), Paragraph (g)(2)(ii), states:
The thermal effects of crud and oxide layers that accumulate on the fuel cladding during plant operation must be evaluated. For the purposes of this paragraph, crud means any foreign substance deposited on the surface of fuel cladding prior to initiation of a LOCA.6
Paragraph (g)(2)(ii) needs to be augmented with additional instructions, explaining that licensees are required to conservatively evaluate the thicknesses and thermal conductivities of crud and/or oxide layers for each fuel cycle.
Licensees will be better able to conservatively evaluate how the thermal effects of crud and oxide layers would increase the peak cladding temperature in the event of a LOCA, if they first conservatively evaluated the thicknesses and thermal conductivities of the crud and/or oxide layers present during each fuel cycle.
At the end of some fuel cycles, it would be helpful to examine the thicknesses and thermal conductivities of crud and oxide layers that had accumulated on fuel cladding; and estimate the quantity of non-tenacious crud released from fuel rods during the refueling outage. This would help to provide valid data for benchmarking ECCS evaluation models.
Clearly, there are a number of factors that could play a role in how much crud would be present in any forthcoming operating cycle. Ultrasonic fuel cleaning could be used to remove a portion of the existing crud; and of course more crud would accumulate on the fuel cladding.
4 NRC, Commission Voting Record, Decision Item: SECY-12-0034, Proposed Rulemaking—10 CFR 50.46(c): Emergency Core Cooling System Performance During Loss-of-Coolant Accidents (RIN 3150-AH42), January 7, 2013, (ADAMS Accession No. ML13008A368).
5 Rui Hu, Mujid S. Kazimi, Mark Leyse, “Considering the Thermal Resistance of Crud in LOCA Analysis,” American Nuclear Society, 2009 Winter Meeting, Washington, D.C., November 15-19, 2009.
6 NRC, “Proposed Rulemaking: 10 CFR 50.46c: Emergency Core Cooling System Performance During Loss-of-Coolant Accidents,” SECY-12-0034, March 1, 2012, p. 84.
5
But it’s important to note that there are models of crud and oxide deposition that have been developed that are intended to predict of the thicknesses of crud deposits and oxide layers on the fuel cladding. (For example, such information is mentioned in a 2003 paper titled “Taming the Crud Problem: The Evolution.”7)
In the question-and-answer session after a presentation I gave at NRC headquarters on June 24, 2014 regarding the Section 50.46c proposed rule, Paul Clifford made what I believe is an important point. He pointed out that during a fuel cycle there could be “fluffy,” non-tenacious crud on the fuel rods, which would not be observed at the end of the fuel cycle. Non-tenacious crud can be released from fuel rods during refueling outages; this is sometimes termed a “crud burst.” Regarding some observed crud bursts, Electric Power Research Institute (“EPRI”) states that “[s]everal PWRs have experienced anomalous crud releases during refueling outages, characterized by unexpectedly high particulate crud releases followed by deposition or by abnormally high activity releases after peroxide addition (or release after floodup).”8
It is pertinent that EPRI has developed a BWR crud-deposition model called the Crud DepOsition Risk Assessment ModeL (“CORAL”),9 “[t]o facilitate improved management of any crud-related fuel performance risk.”10
Regarding CORAL, EPRI states:
The BWR Fuel Crud Model provides a prediction of the crud deposition and tenacious crud layer thickness both radially and axially within a selected fuel assembly throughout the entire operating history of the assembly. The analysis inputs include the fuel assembly geometry and actual or projected operating history, as well as crud inputs determined from a reactor system mass balance. A boiling deposition model, in conjunction with mechanistic crud release models, defines the deposited inventory along the length of all fuel rods within the fuel assembly. The deposited crud material is separated between an outer loose, fluffy layer and an inner tenacious layer. The thickness of the tenacious layer is determined [emphasis added].
7 Yovan D. Lukie, Jeffrey S. Schmidt, “Taming the Crud Problem: The Evolution,” Advances in Nuclear Fuel Management 2003 Hilton Head Island, South Carolina, USA, October 2003.
8 EPRI, “Product Abstract: High Activity Crud Burst Impacts and Responses,” available at:
http://www.epri.com/abstracts/Pages/ProductAbstract.aspx?ProductId=000000000001016766
9 EPRI, “Product Abstract: Technical Basis and Benchmarking of the Crud Deposition Risk Assessment Model (CORAL),” available at:
http://www.epri.com/abstracts/Pages/ProductAbstract.aspx?productId=000000000001025189
10 EPRI, “Product Abstract: Fuel Reliability Program: BWR Fuel Crud Modeling,” available at:
http://www.epri.com/abstracts/Pages/ProductAbstract.aspx?ProductId=000000000001021034
6
The BWR Fuel Crud Model has been extensively validated through benchmarking of the model using data taken on fuel rods operated in actual commercial BWRs. These benchmarking measurements include (1) poolside fuel deposit sampling of both total and tenacious crud layer, (2) laboratory examination of crud flakes and tenacious deposits on irradiated fuel rods to determine composition, thickness, density, and structure, and (3) poolside eddy current lift-off and cladding diametral profilometry data. This successful benchmarking activity provides confidence in the model’s ability to capture and quantitatively describe crud deposition behavior, as well as quantifying the inherent variability in the crud deposition and release processes and resultant tenacious crud layer thickness11 [emphasis added].
Such models need to be used to predict the thicknesses of crud deposits—for both outer loose, fluffy layers and inner tenacious layers—that would be present on the fuel cladding during each fuel cycle. And such models need to be used for both PWRs and BWRs. Clearly, the thermal effects of crud—for fluffy layers and tenacious layers—and oxide layers need to be evaluated in LOCA analysis; and the thicknesses and thermal conductivities of such layers need to be modeled conservatively.
III. Results of the PHEBUS B9R-2 Test Pertain to How Breakaway Oxidation Could Affect a LOCA
As published in SECY-12-0034, the proposed rule for Section 50.46(c) states:
Breakaway oxidation, for zirconium-alloy cladding material, means the fuel cladding oxidation phenomenon in which weight gain rate deviates from normal kinetics. This change occurs with a rapid increase of hydrogen pickup during prolonged exposure to a high-temperature steam environment, which promotes loss of cladding ductility.12
And Draft Regulatory Guide 1261 states that “breakaway oxidation is an instability phenomenon that can spread rapidly in the axial and circumferential directions” of fuel rods and that there is a criterion of 200-weight parts per million (wppm) for hydrogen pickup. It says that
11 Id.
12 NRC, “Proposed Rulemaking: 10 CFR 50.46c: Emergency Core Cooling System Performance During Loss-of-Coolant Accidents,” SECY-12-0034, March 1, 2012, p. 78.
7
fuel-cladding ductility is maintained as long as the average hydrogen content is below 435 wppm.13
Draft Regulatory Guide 1261 states:
[T]he 200-wppm hydrogen pickup criterion is conservative by a factor of at least two. However, it is not overly conservative for high oxidation temperatures because the time needed to increase from 200 wppm to >400 wppm hydrogen pickup could be as low as 100 seconds.14
When high burnup and other fuel rods are discharged from the reactor core, the fuel cladding can have local zirconium dioxide (ZrO2) “oxide” layers that are up to 100 microns (μm) thick (or greater); there can also be local crud layers on top of the oxide layers. And according to NUREG/CR-6851, medium to high burnup fuel cladding typically has a “hydrogen concentration in the range of 100-1000 wppm;” it adds that “[z]irconium-based alloys, in general, have a strong affinity for oxygen, nitrogen, and hydrogen…”15
NRC’s conclusions on how hydrogen content affects fuel cladding ductility are based on the results of isothermal experiments conducted with small specimens. These were experiments in which a tiny section of a fuel rod was held at a constant temperature. I think most of this program was done at Argonne; and there were some tests done with pre-oxidized fuel cladding.
The PHEBUS B9R-2 test is an integral experiment conducted with pre-oxidized fuel cladding, which I recommend the NRC study. PHEBUS B9R-2 was conducted in a light water reactor—as part of the PHEBUS severe fuel damage program—with an assembly of 21 UO2 fuel rods.16 A 1996 European Commission report states that the B9R-2 test had an unexpected fuel-cladding temperature escalation in the mid-bundle region; the highest temperature escalation rates were from 20°C/sec (36°F/sec) to 30°C/sec (54/°F/sec).17
13 NRC, “Conducting Periodic Testing for Breakaway Oxidation Behavior,” Draft Regulatory Guide 1261, Undated, Appendix B: Rational for the 200-wppm Hydrogen Pickup Criterion for Breakaway Oxidation,” (ADAMS Accession No: ML111100300), p. B-1.
14 Id.
15 K. Natesan, W.K. Soppet, Argonne National Laboratory, “Hydrogen Effects on Air Oxidation of Zirlo Alloy,” NUREG/CR-6851, October 2004, (ADAMS Accession No: ML042870061), p. iii, 3.
16 G. Hache, R. Gonzalez, B. Adroguer, Institute for Protection and Nuclear Safety, “Status of ICARE
Code Development and Assessment,” in NRC “Proceedings of the Twentieth Water Reactor Safety
Information Meeting,” NUREG/CP-0126, Vol. 2, 1992, (ADAMS Accession No: ML042230126), p. 311.
17 T.J. Haste et al., “In-Vessel Core Degradation in LWR Severe Accidents,” European Commission,
Report EUR 16695 EN, 1996, p. 33.
8
Discussing PHEBUS B9R-2, the 1996 European Commission report states:
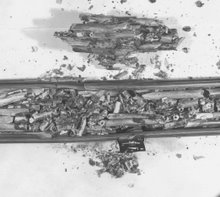
The B9R-2 test…illustrates the oxidation in different cladding conditions representative of a pre-oxidized and fractured state. … During B9R-2, an unexpected strong escalation of the oxidation of the remaining Zr occurred when the bundle flow injection was switched from helium to steam while the maximum clad temperature was equal to 1300 K [1027°C (1880°F)]. The current oxidation model was not able to predict the strong heat-up rate observed even taking into account the measured large clad deformation and the double-sided oxidation (final state of the cladding from macro-photographs).
… No mechanistic model is currently available to account for enhanced oxidation of pre-oxidized and cracked cladding.18
As stated, the cladding-temperature escalation commenced at approximately 1027°C (1880°F). That is thermal runaway. The fact that PHEBUS B9R-2 was conducted with a preoxidized test bundle makes its results pertinent to the cladding of medium and high burnup fuel rods.
The hydrogen content of the cladding of PHEBUS B9R-2 test bundle most likely played a role in the test results. I think the results indicate what could happen in a LOCA; the test was conducted under conditions far more representative of LOCA conditions than the Argonne tests with tiny specimens.
As quoted above, Draft Regulatory Guide 1261 states that breakaway oxidation deviates from normal kinetics. It seems that normal oxidation kinetics are supposed to be those observed in the tests with tiny zirconium specimens held at a constant temperature. In such tests the rate of steam flow is controlled. And different adjustments can influence oxidation rates. This is discussed in a paper by Gerhard Schanz titled “Recommendations and Supporting Information on the Choice of Zirconium Oxidation Models in Severe Accident Codes.” The Schanz paper states that an investigator “reached an important improvement of the specimen temperature homogeneity by only optimizing the geometry of the specimen and registered considerably increased reaction rates.”19
I think that any honest, objective study of the results of the PHEBUS B9R-2 test and those of a number of other integral experiments conducted with multi-rod bundles of fuel rod simulators or real fuel rods with UO2 fuel would reveal many deviations from so-called normal
18 Id., p. 126.
19 Gerhard Schanz, “Recommendations and Supporting Information on the Choice of Zirconium
Oxidation Models in Severe Accident Codes,” FZKA 6827, 2003, p. 5.
9
oxidation kinetics. The reaction rates have been rapid in a number of the large-scale, integral experiments. In those cases thermal runaway is more of an issue than cladding embrittlement. Preventing thermal runaway could be a more important safety issue than preventing excessive cladding embrittlement.
IV. Results of the PHEBUS B9R-2 Test Pertain to the 2200°F Peak Cladding Temperature Limit
The results of the PHEBUS B9R-2 test should be reviewed, along with other integral experiments to help determine if the proposed rule for Section 50.46(c), Paragraph (g)(1)(i) is non-conservative. That is, the test results of integral experiments may indicate that the 2200°F peak cladding temperature limit needs to be lowered. In a large break LOCA there could be steam-binding conditions that would not allow much coolant to be injected. This could cause the fuel-cladding temperature to increase at a rate of approximately 10°F per second or greater—mainly from the stored energy (heat) in the fuel, at the beginning of the LOCA. And if the peak fuel-cladding temperature were to reach approximately 1832°F in a steam environment; and there were little or no coolant injection, there would probably be results similar to those of the PHEBUS B9R-2 test, in which thermal runaway commenced when peak fuel-cladding temperatures were lower than 2200°F.
Respectfully submitted,
/s/
____________________________
Mark Edward Leyse
P.O. Box 1314
New York, NY 10025
markleyse@gmail.com